A tour of Bield
The sidebar has nine pages, in this order. Press g and then a number to jump to one, Ctrl+K (⌘K on a Mac) to search pages, devices and actions, and ? for every shortcut. Admins see all nine. Viewers don’t see Terminal, Files or Settings, and some fields are left out of the others.
You can look at all of this without installing anything: bield serve --demo runs a made-up tailnet (Demo mode).
Overview
Section titled “Overview”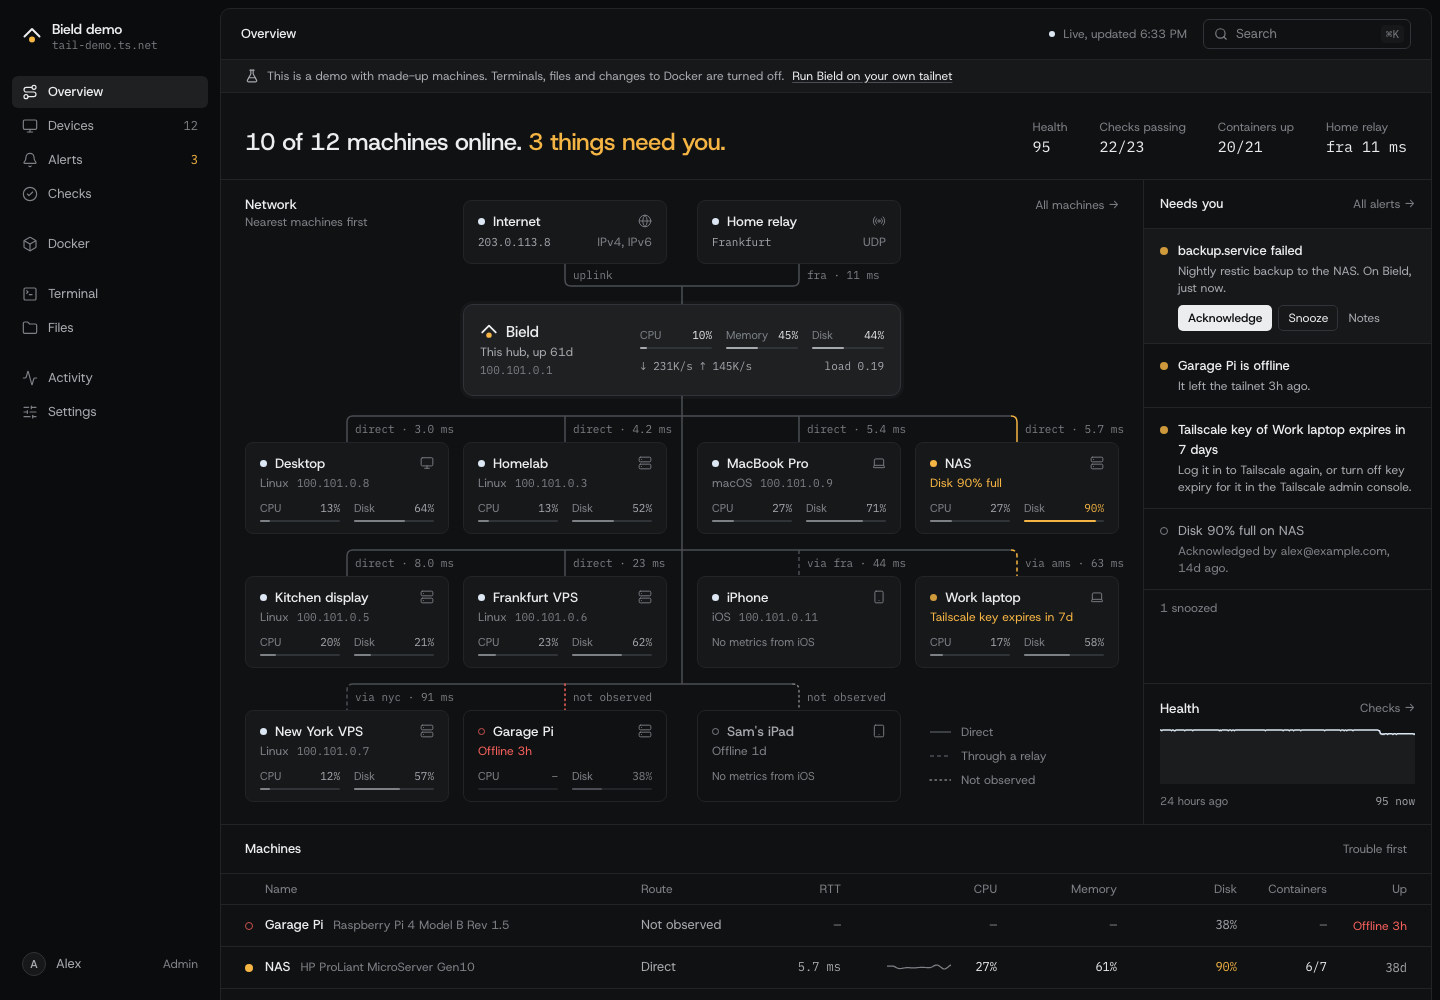
How the tailnet is doing, at a glance. The headline says how many machines are online and how many things need you, next to the health score, how many checks pass, how many containers are up and the home relay. Under it is a map: the internet and Tailscale’s relay at the top, the hub in the middle, and every other machine below it, nearest first, with the kind of path to each and its round-trip time. A solid line is direct, a dashed one goes through a relay, and a dotted one isn’t observed. Color means something’s wrong: a healthy machine stays pale, one that needs attention is amber, and one that’s offline with an alert is red.
Needs you lists the open alerts, which you can act on right there, with the health score over the last day under them. A table of machines sits below, with the ones in trouble first. If one of Bield’s sources is failing (Tailscale, the hub’s own metrics, the network check, Docker, systemd), a line under the headline says so, and Activity has all of them.
The first time an admin opens Bield, the Overview sends them to the first-run setup.
Devices
Section titled “Devices”A table of every machine on the tailnet with its status, how traffic reaches it (the route), its tailnet IP, and, for machines that report, its CPU, memory and disk, and how long it has been up or offline. Filter by status. Agents in the corner opens the agent page.
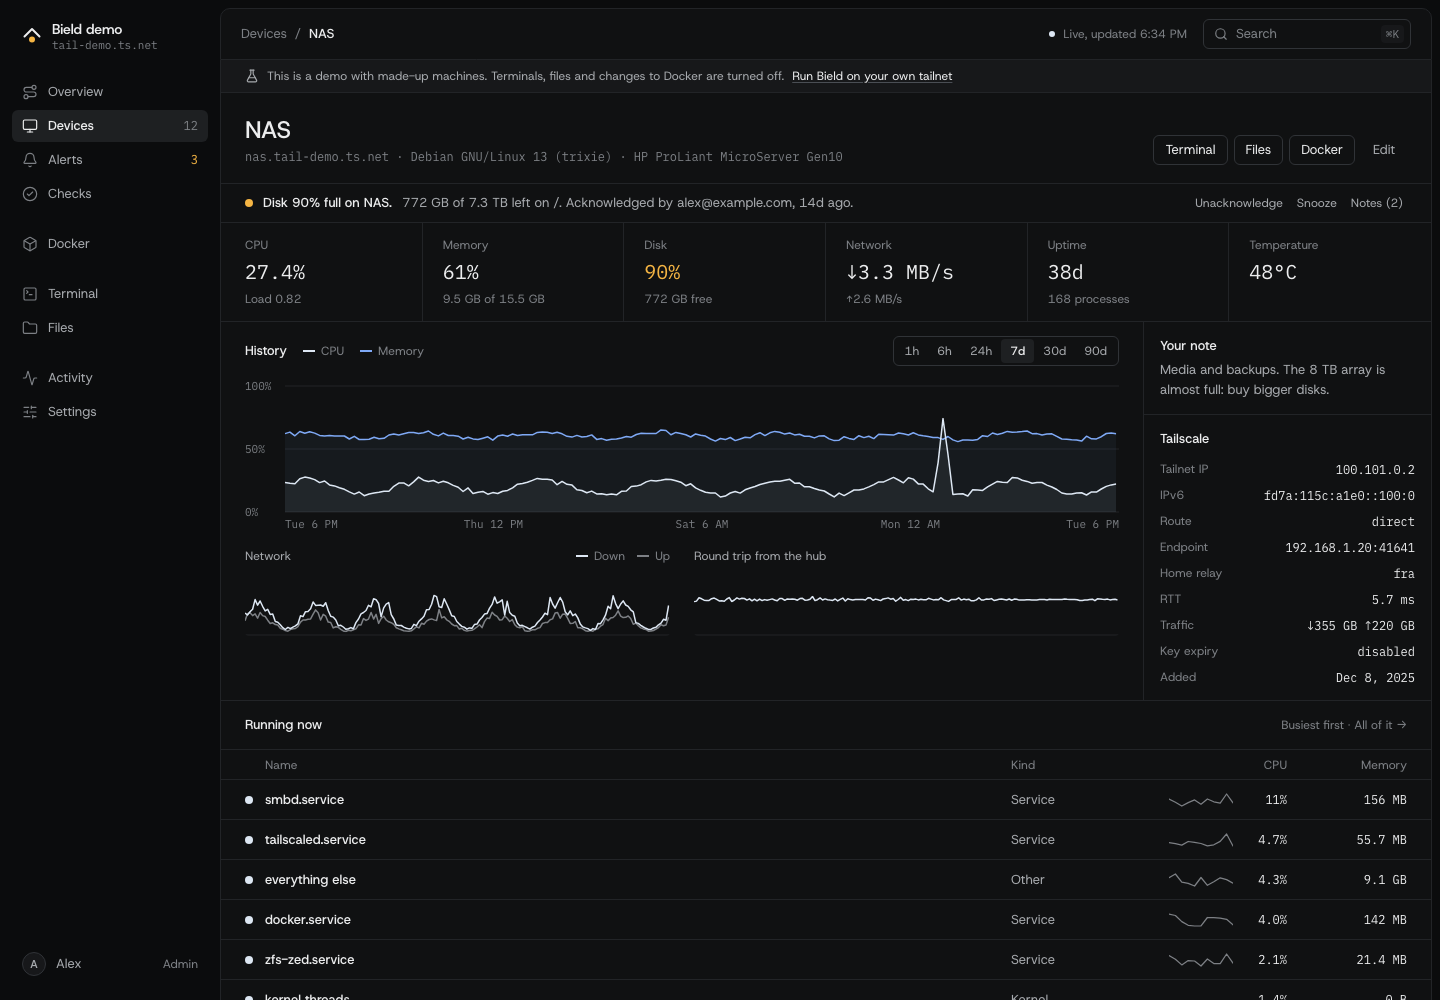
A machine’s page has:
- Buttons for Terminal, Files and Docker, when Bield has SSH access.
- CPU, memory, disk, network and uptime across the top, and one more for battery, temperature or swap, if it has an agent or Bield measures it.
- A line for each open alert, which you can acknowledge or snooze there.
- History, with charts for 1 hour to 90 days: CPU and memory, network, and the round-trip time. Point at the first to see what was running then, and click for all of it.
- Running now: what uses its CPU and memory, the busiest first, with a link to all of it and the trend over days.
- Its Tailscale details: addresses, the route and endpoint, the home relay, the key’s expiry, and how much traffic has passed.
- Your note on it, the System details the agent reports, and the cards for SSH access and the agent.
Edit changes the machine’s name, its type, its thresholds and its notes. See per-device thresholds.
Alerts
Section titled “Alerts”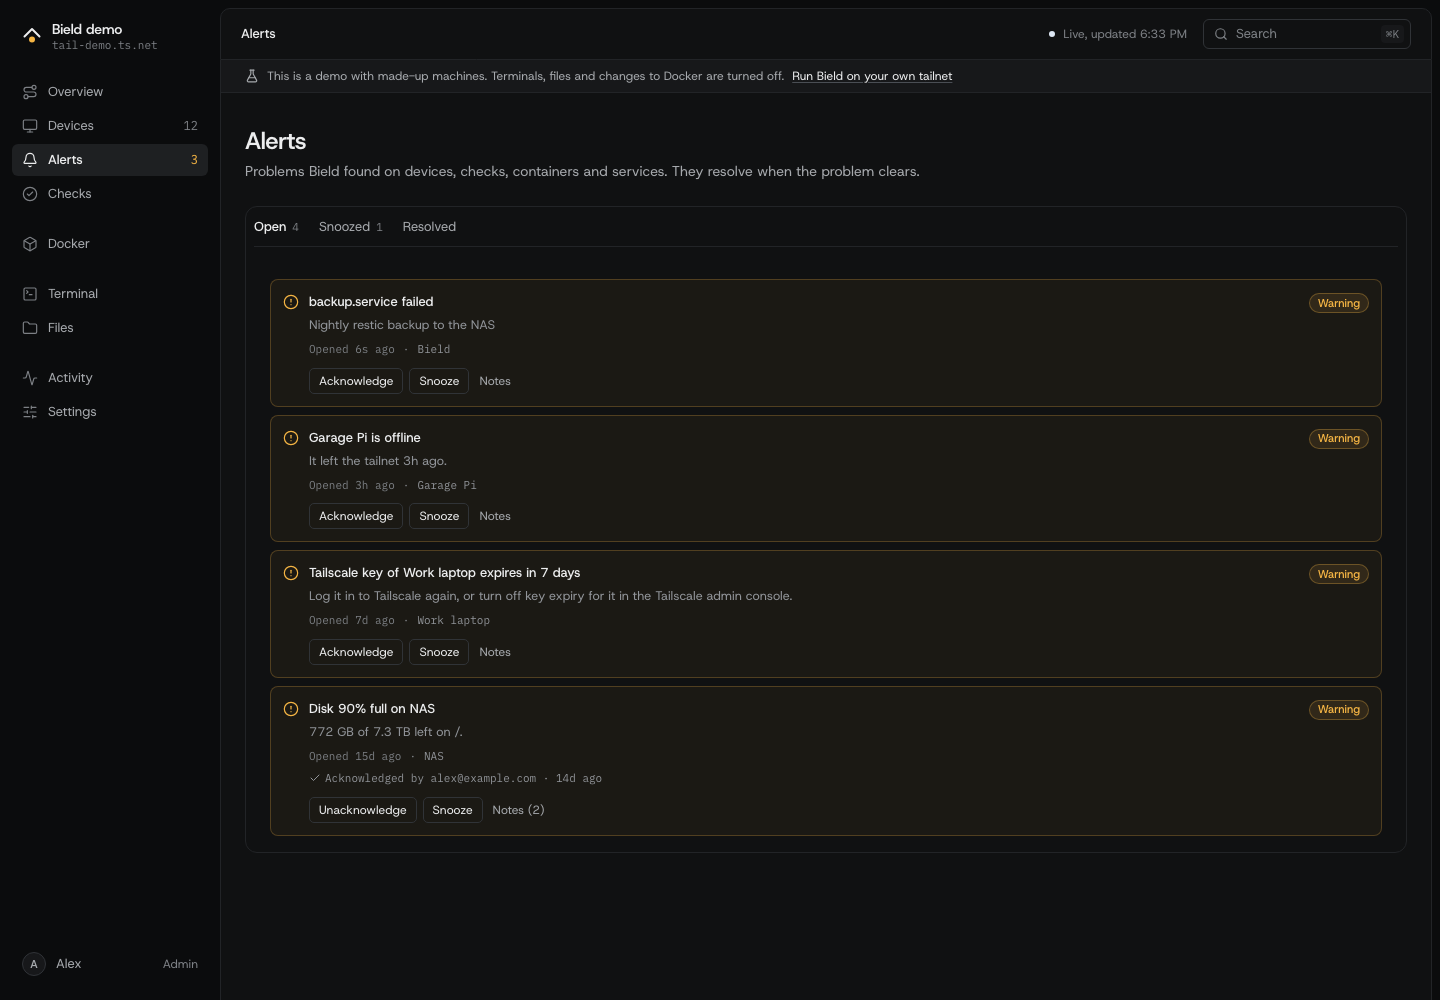
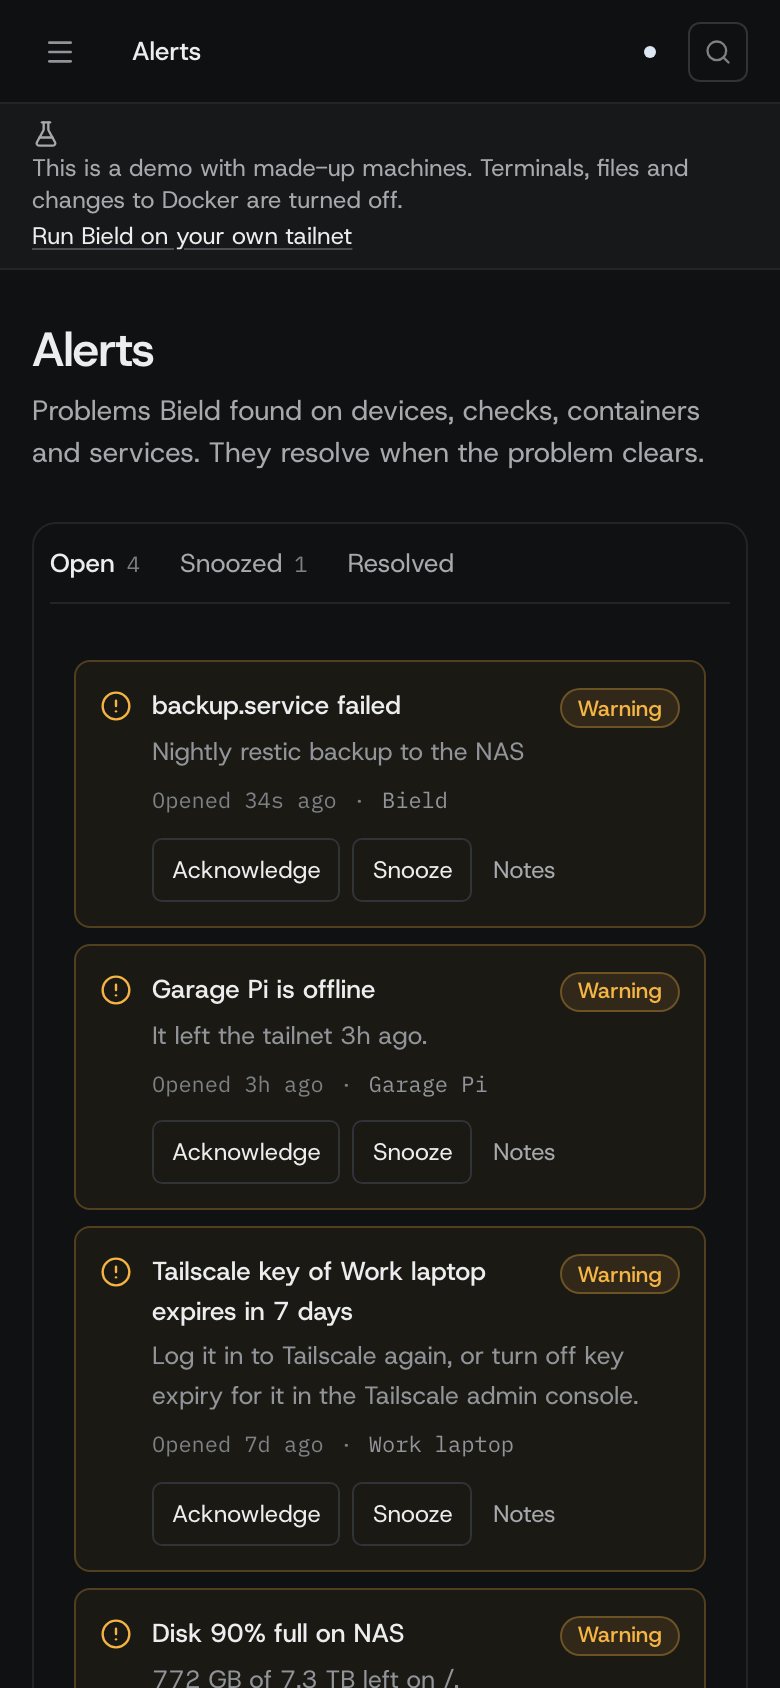
Problems Bield found on devices, checks, containers and services. An alert opens when a rule’s condition becomes true, and resolves a minute after it stops. The rules and their thresholds are in Settings.
The tabs are Open, Snoozed and Resolved. On an alert, an admin can:
- Acknowledge it, which says someone has seen it and stops notifications and reminders. Unacknowledge takes that back.
- Snooze it for 1 hour, 4 hours, 1 day or 1 week. It comes back when the time is up if the problem is still there.
- Add Notes, such as what you did. They stay with the alert after it resolves.
Each alert has its own link, /alerts?alert=<id>, which notifications use.
Checks
Section titled “Checks”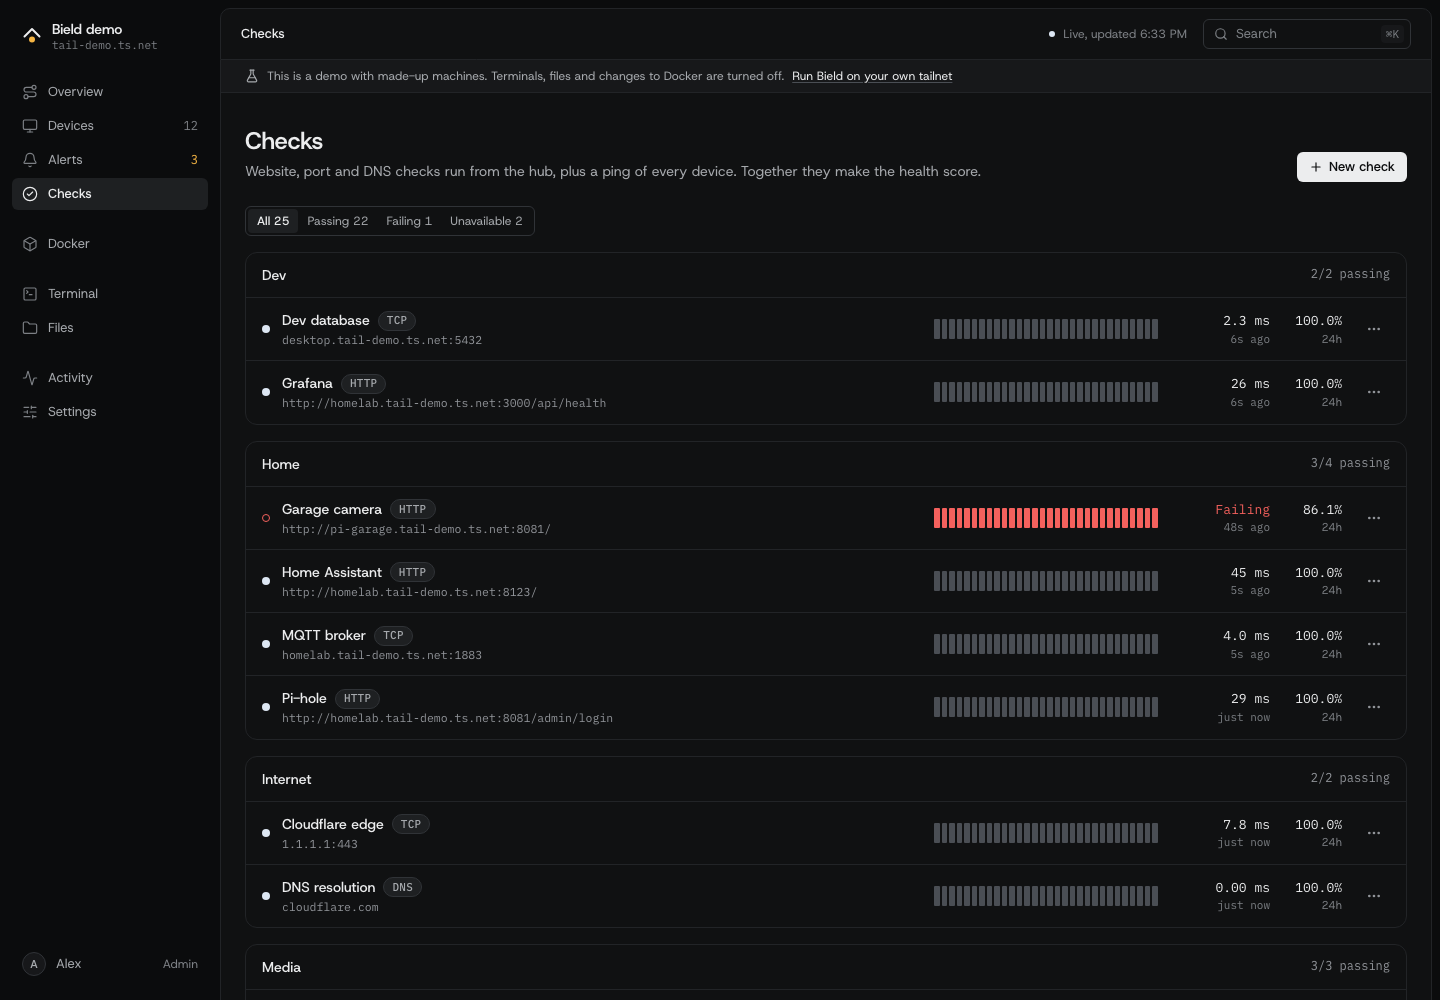
Checks run from the hub, on a schedule. There are three kinds:
| Kind | What it does | Target |
|---|---|---|
| HTTP | Makes a request, and passes if the status is the one you expect, or any status below 400. It doesn’t follow redirects. Skip TLS check accepts a certificate of its own. | A URL |
| TCP | Opens a connection. | host:port |
| DNS | Looks the name up, with the hub’s own resolver. | A name |
Each check has a name, a group, an interval (from 10 seconds to a day, 1 minute by default), and a timeout (from 200 ms up to a minute, 5 seconds by default, and shorter than the interval). The hub runs up to six checks at once. A check can be paused, and run on demand. A check’s target is a name or address that the hub can reach, so use 127.0.0.1 for the hub’s own machine, or a tailnet name for another. Bield keeps only the status line of an answer, never the body.
Every device on the tailnet also has a ping check, made by Bield, which fails when the device is online and doesn’t answer pings. A new Bield has three checks in a group called Internet: TCP to 1.1.1.1:443, a DNS lookup of cloudflare.com, and an HTTPS request to https://www.google.com/generate_204. They show whether the hub can get online. Delete them if you don’t want Bield to make those requests.
The health score is the share of live checks that pass, rounded down. It’s healthy from 90 and degraded from 70. The Overview shows it with its last day. A check that keeps failing opens an alert.
Docker
Section titled “Docker”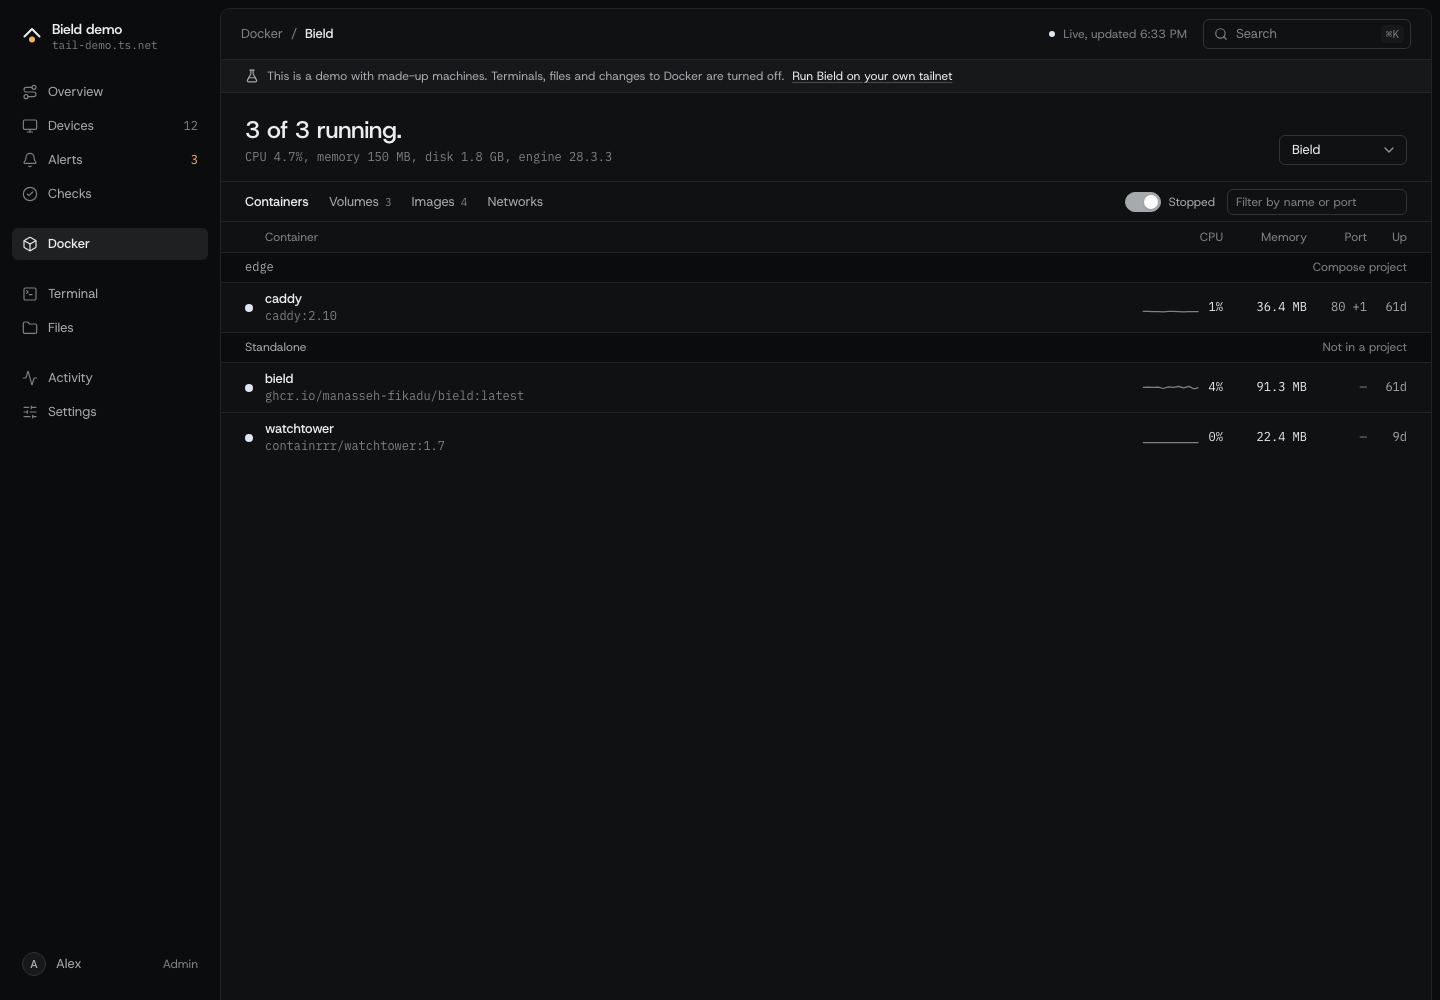
The containers, volumes, images and networks of one machine, picked at the top. The machine Bield runs on works when it can use the Docker socket (Docker on the same machine, Docker). Another machine needs SSH access.
The headline says how many containers run and how many are unhealthy or crashed, with their CPU, memory and disk use and the engine version. Containers are grouped by Compose project, with what’s wrong, their CPU, memory, port and uptime. On a wide screen, clicking one opens it beside the list, with its logs, its stats and what an admin can do to it. Volumes, images and networks have their own tabs, and each says what uses it.
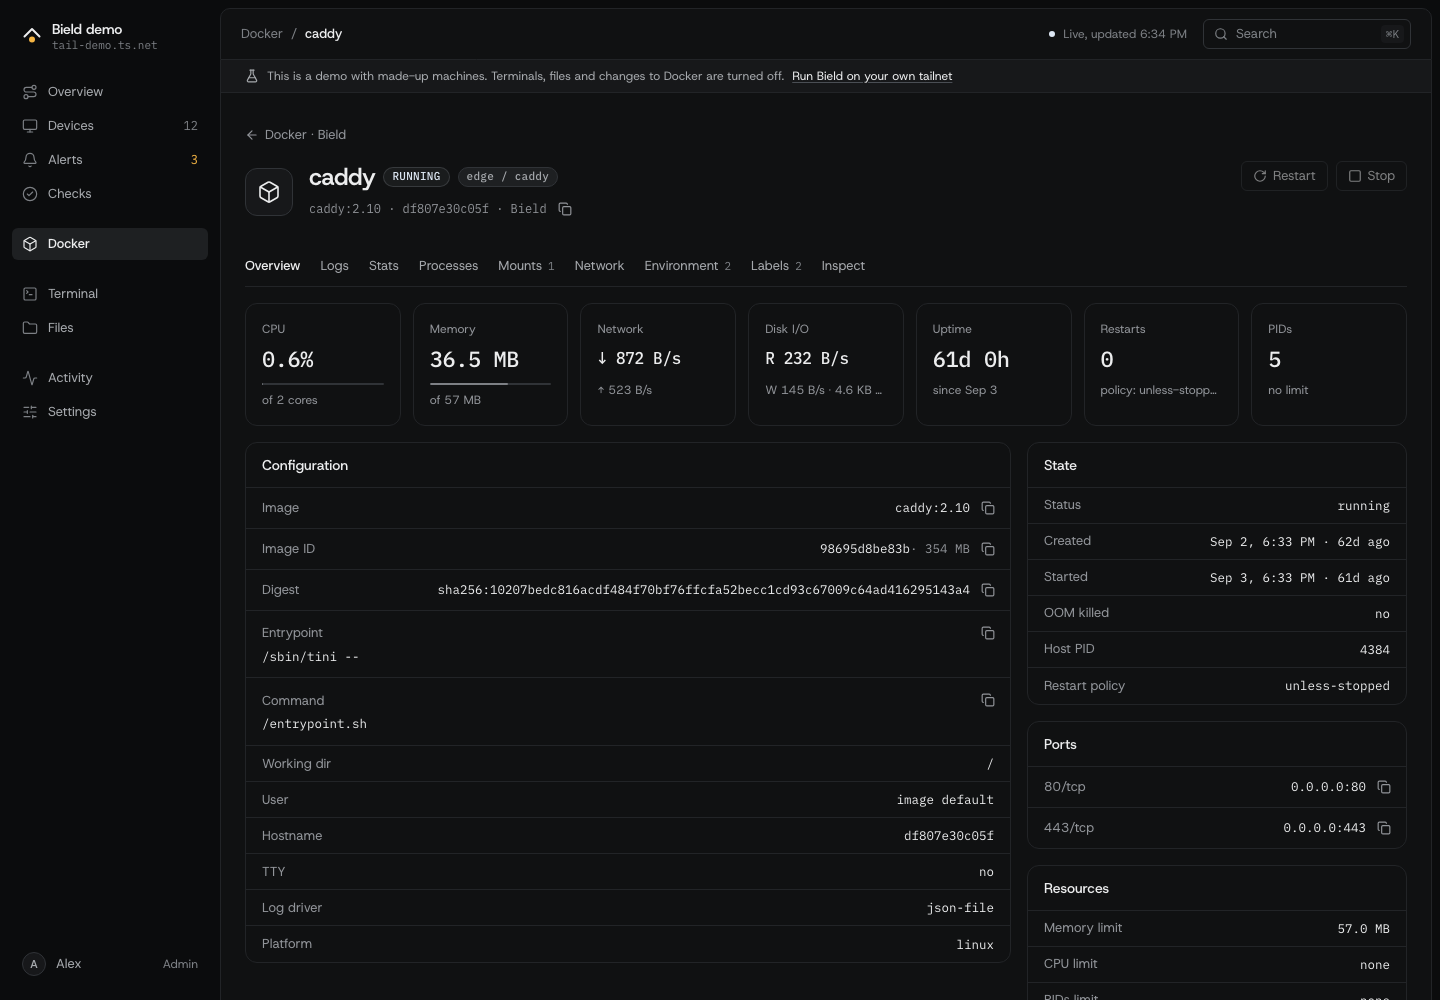
A container’s page has tabs for Logs (which follow live, and can be searched), Stats (live charts, and history), Processes, Mounts, Network, Environment, Labels and Inspect. Admins can Start, Stop and Restart it. Those are the only things Bield does to Docker. There’s no create, exec or prune.
Terminal
Section titled “Terminal”A shell on a machine, in the browser, in tabs. With tmux on the machine, a session keeps running after you close its tab. Admins only. See Terminal.
A file manager for a machine’s disk: browse, preview, edit, upload, download, rename, copy, move, delete and search. On a wide screen, a file opens beside the list. The side has shortcuts to folders, your bookmarks and the machine’s Docker volumes. Admins only. See Files.
Activity
Section titled “Activity”Devices coming and going, alerts opening and resolving, and what people did in Bield. Filter it by Devices, Agents, Alerts, Checks, Containers, Access, Settings, SSH, Terminals, Files or Notifications. It records who did what and when: terminals opened, files changed, containers started, settings changed, roles given. It doesn’t record what was typed in a terminal or what a file held. How long it keeps events is the Activity log setting under Retention.
Settings
Section titled “Settings”How Bield behaves and who can use it, in six tabs. See Settings.
First-run setup
Section titled “First-run setup”The first time an admin opens the Overview, Bield opens /setup: a few checks and choices. It shows whether Bield sees Tailscale, Docker and systemd, with the fix for any that it doesn’t, lets you name this Bield and confirm the admins, and points to the next steps: connecting more machines and setting up notifications. Skip any step. Settings, General brings it back.
On a phone
Section titled “On a phone”The sidebar becomes a menu, tables become lists, and buttons and menus are sized for a finger.
What viewers see
Section titled “What viewers see”A viewer sees the Overview, Devices, Alerts, Checks, Docker and Activity, without logs, files, terminals or secrets. Container environment variables, commands, health check output, and process command lines are left out. So are check targets, which can hold tokens, and the activity lines about access, SSH, terminals and files. Viewers can’t acknowledge alerts or change anything. Admins and viewers says how to give someone a role.